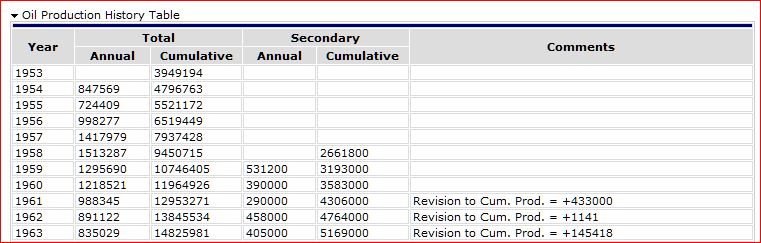
The Oil Production History Table contains the volume of oil annually produced for a field. Additionally, the table also reports the estimated volume attributable to Secondary (Enhanced) Recovery.
Example Screen Clip:
Each row of the table represents a single reporting year (column 1). The lone exception is for fields that were already producing before 1953. For pre-1953 fields, the volume reported in the table for 1953 is for all years up to and including 1953.
The "Total" column is split into two columns, the left-hand column is Total Annual production which contains the total volume of reported oil produced during that year. The right-hand column is the Total Cumulative production, which is cumulative volume of oil production produced in the reporting year plus oil produced during all previous years.
The estimated amount of Secondary Production for each year is given in the Secondary Annual column. The Secondary Cumulative column contains the estimated volume of production for that year plus all previous years for which it was estimated.
The term Secondary Production is defined somewhat variously within the petroleum industry, as are the terms primary production/recovery, enhanced production/recovery. These terms are discussed at length in the help topic Secondary Oil Production.
A few points should be noted here:
Reported Secondary Production volumes are IGS estimates determined by assumptions and calculations. There is no way to measure how many actual produced barrels are the result of secondary recovery. The intent of reporting Secondary Production is to provide a general sense of the significance of Secondary Production.
The reported secondary values are independent of the actual volumes reported for the field.
Depending on the field, the proportion of secondary production to that of an entire field may not be material because the waterflood only covers part of the field. As an extreme example, if a field has 200 oil wells producing from 3 different formations, and a small but profitable waterflood has been initiated in a local area involving only 5 wells completed in only one formation, the waterflood production may appear tiny compared to the total production history for the entire field overall production volume.
The Comments column relates any other pertinent details related to the values shown in the table. Comments usually refer to adjustments to previous years' reported volumes, or to information about field consolidations involving the subject field.
Values contained in the Oil Production History Table are used to build a graph of cumulative oil production from the field. The Oil Production History Graph opens when selected on the Field and Production Summary [in Fields and Production Module].