The initial phase of oil production in an oil field is commonly termed the primary phase. Primary production is oil initially recovered from a field either from wells flowing under natural pressure, or wells that produce by means of pumps that carry oil from the well bore to tanks at the ground surface.
Secondary production is the initial phase of Enhanced Recovery in a Petroleum Field or well. Historically, secondary production has mostly involved waterflooding an oil reservoir (injecting water in some wells to "push" more oil through the reservoir toward other producing wells). Waterflooding may begin at any time after the field begins primary production depending on the operator's evaluation.
In the Fields and Production Module of the PDMS, Secondary Oil Production includes all types of Enhanced Recovery employed in the field. The secondary production for an Petroleum Field was determined by visual inspection of the charts that show oil production curves for each field.
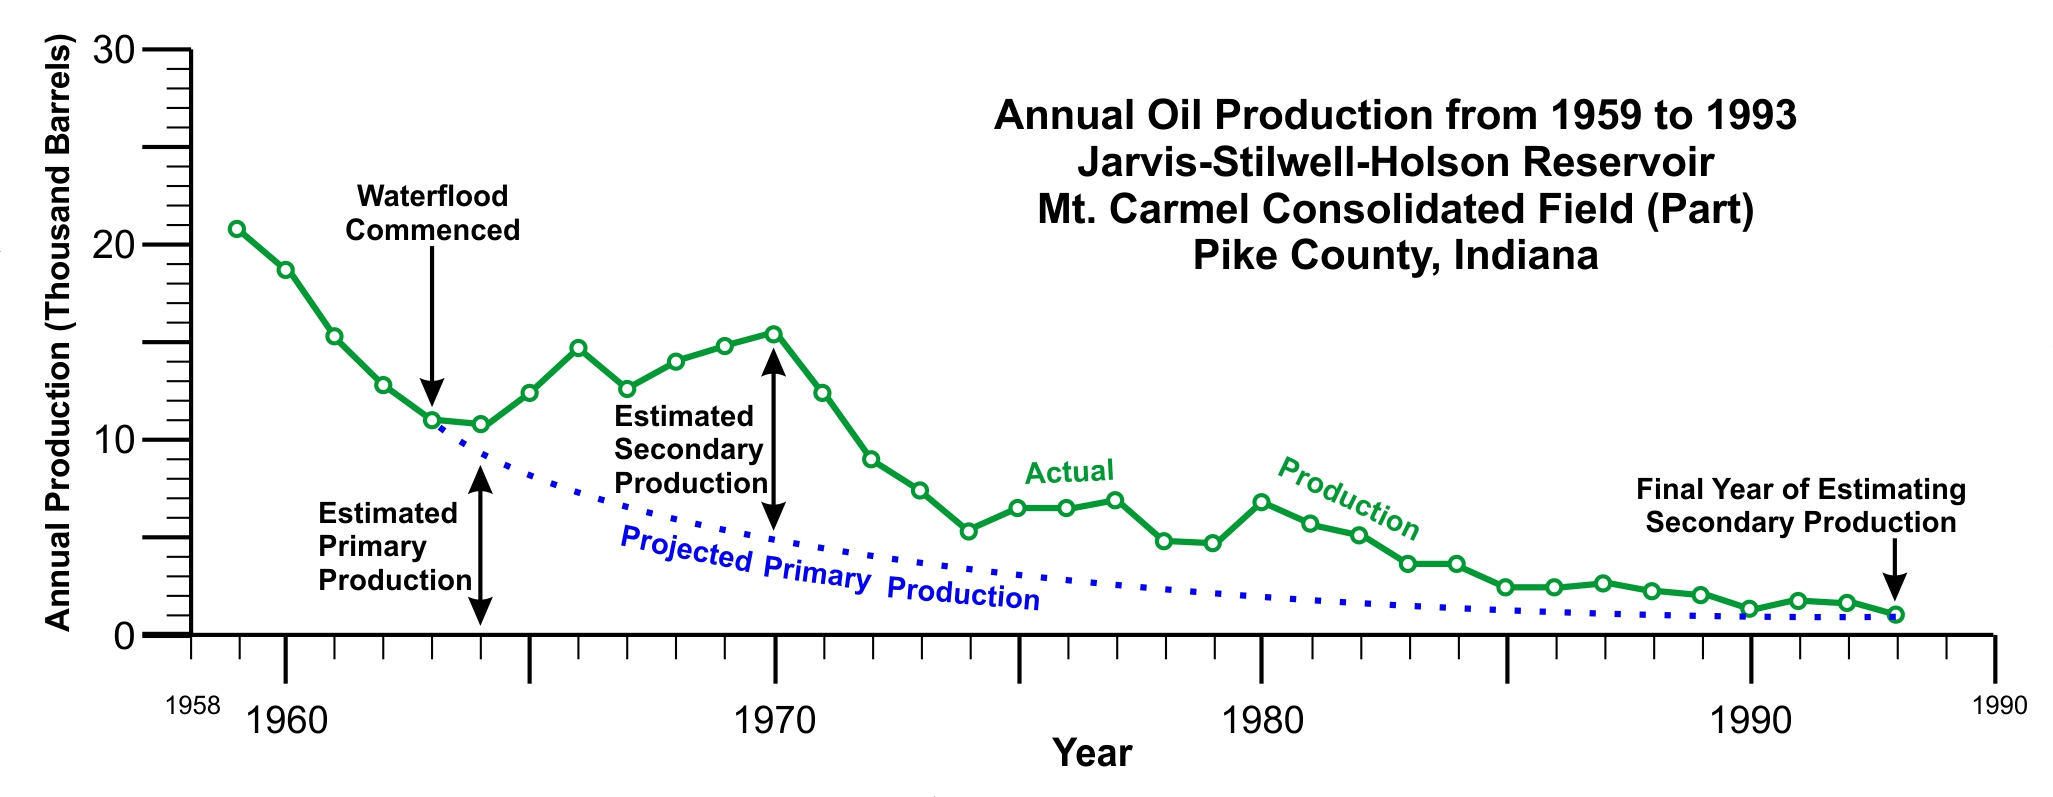
The production chart for the Jarvis-Stilwell-Holsen portion of the Mt. Carmel Consolidated Field is a good illustration showing how the IGS estimated secondary oil production.
First, actual annual oil production is plotted on a graph. A sharp flattening of the curve at 1963 leading to the reversal of declining production marks the beginning of secondary production. Drilling permits and completion dates may have been used to pinpoint the start of secondary production. One must also consider whether new drilling rather than secondary recovery is responsible for an upswing in oil production.
In the example, production was entirely primary from 1959 through 1963.
The projected primary curve was visually extended into the future in a manner consistent with the history of known fields outside of Indiana. Although no record of the models that were used is available, the original charts used to determine secondary production from all Indiana oil fields are available and they can be obtained from the IGS (contact igsinfo@indiana.edu).
After secondary production is initiated, the area below the Production Decline Curve is defined as "Estimated Primary Production" and the area above the curve is "Estimated Secondary Production." Essentially, any production that exceeds the anticipated primary production is generally ascribed to secondary recovery techniques (usually waterflooding).
The final year for reporting an estimated secondary volume for all Indiana oil fields was 1994. On the example graph, it is evident that actual production curve and the estimated primary production curve represent roughly the same volume, and the same held true for most oil fields in Indiana at the time. Assuming no significant additional changes, there would be little point in estimating a secondary production volume. On the other hand, one might claim that all of the production should be considered to be secondary because the producing wells would likely have been plugged by that time if their lives had not already been extended by secondary recovery. However one defines secondary production at the end of a field's life, the IGS decided that there was little point in continuing the practice of differentiating estimated primary and secondary volumes.