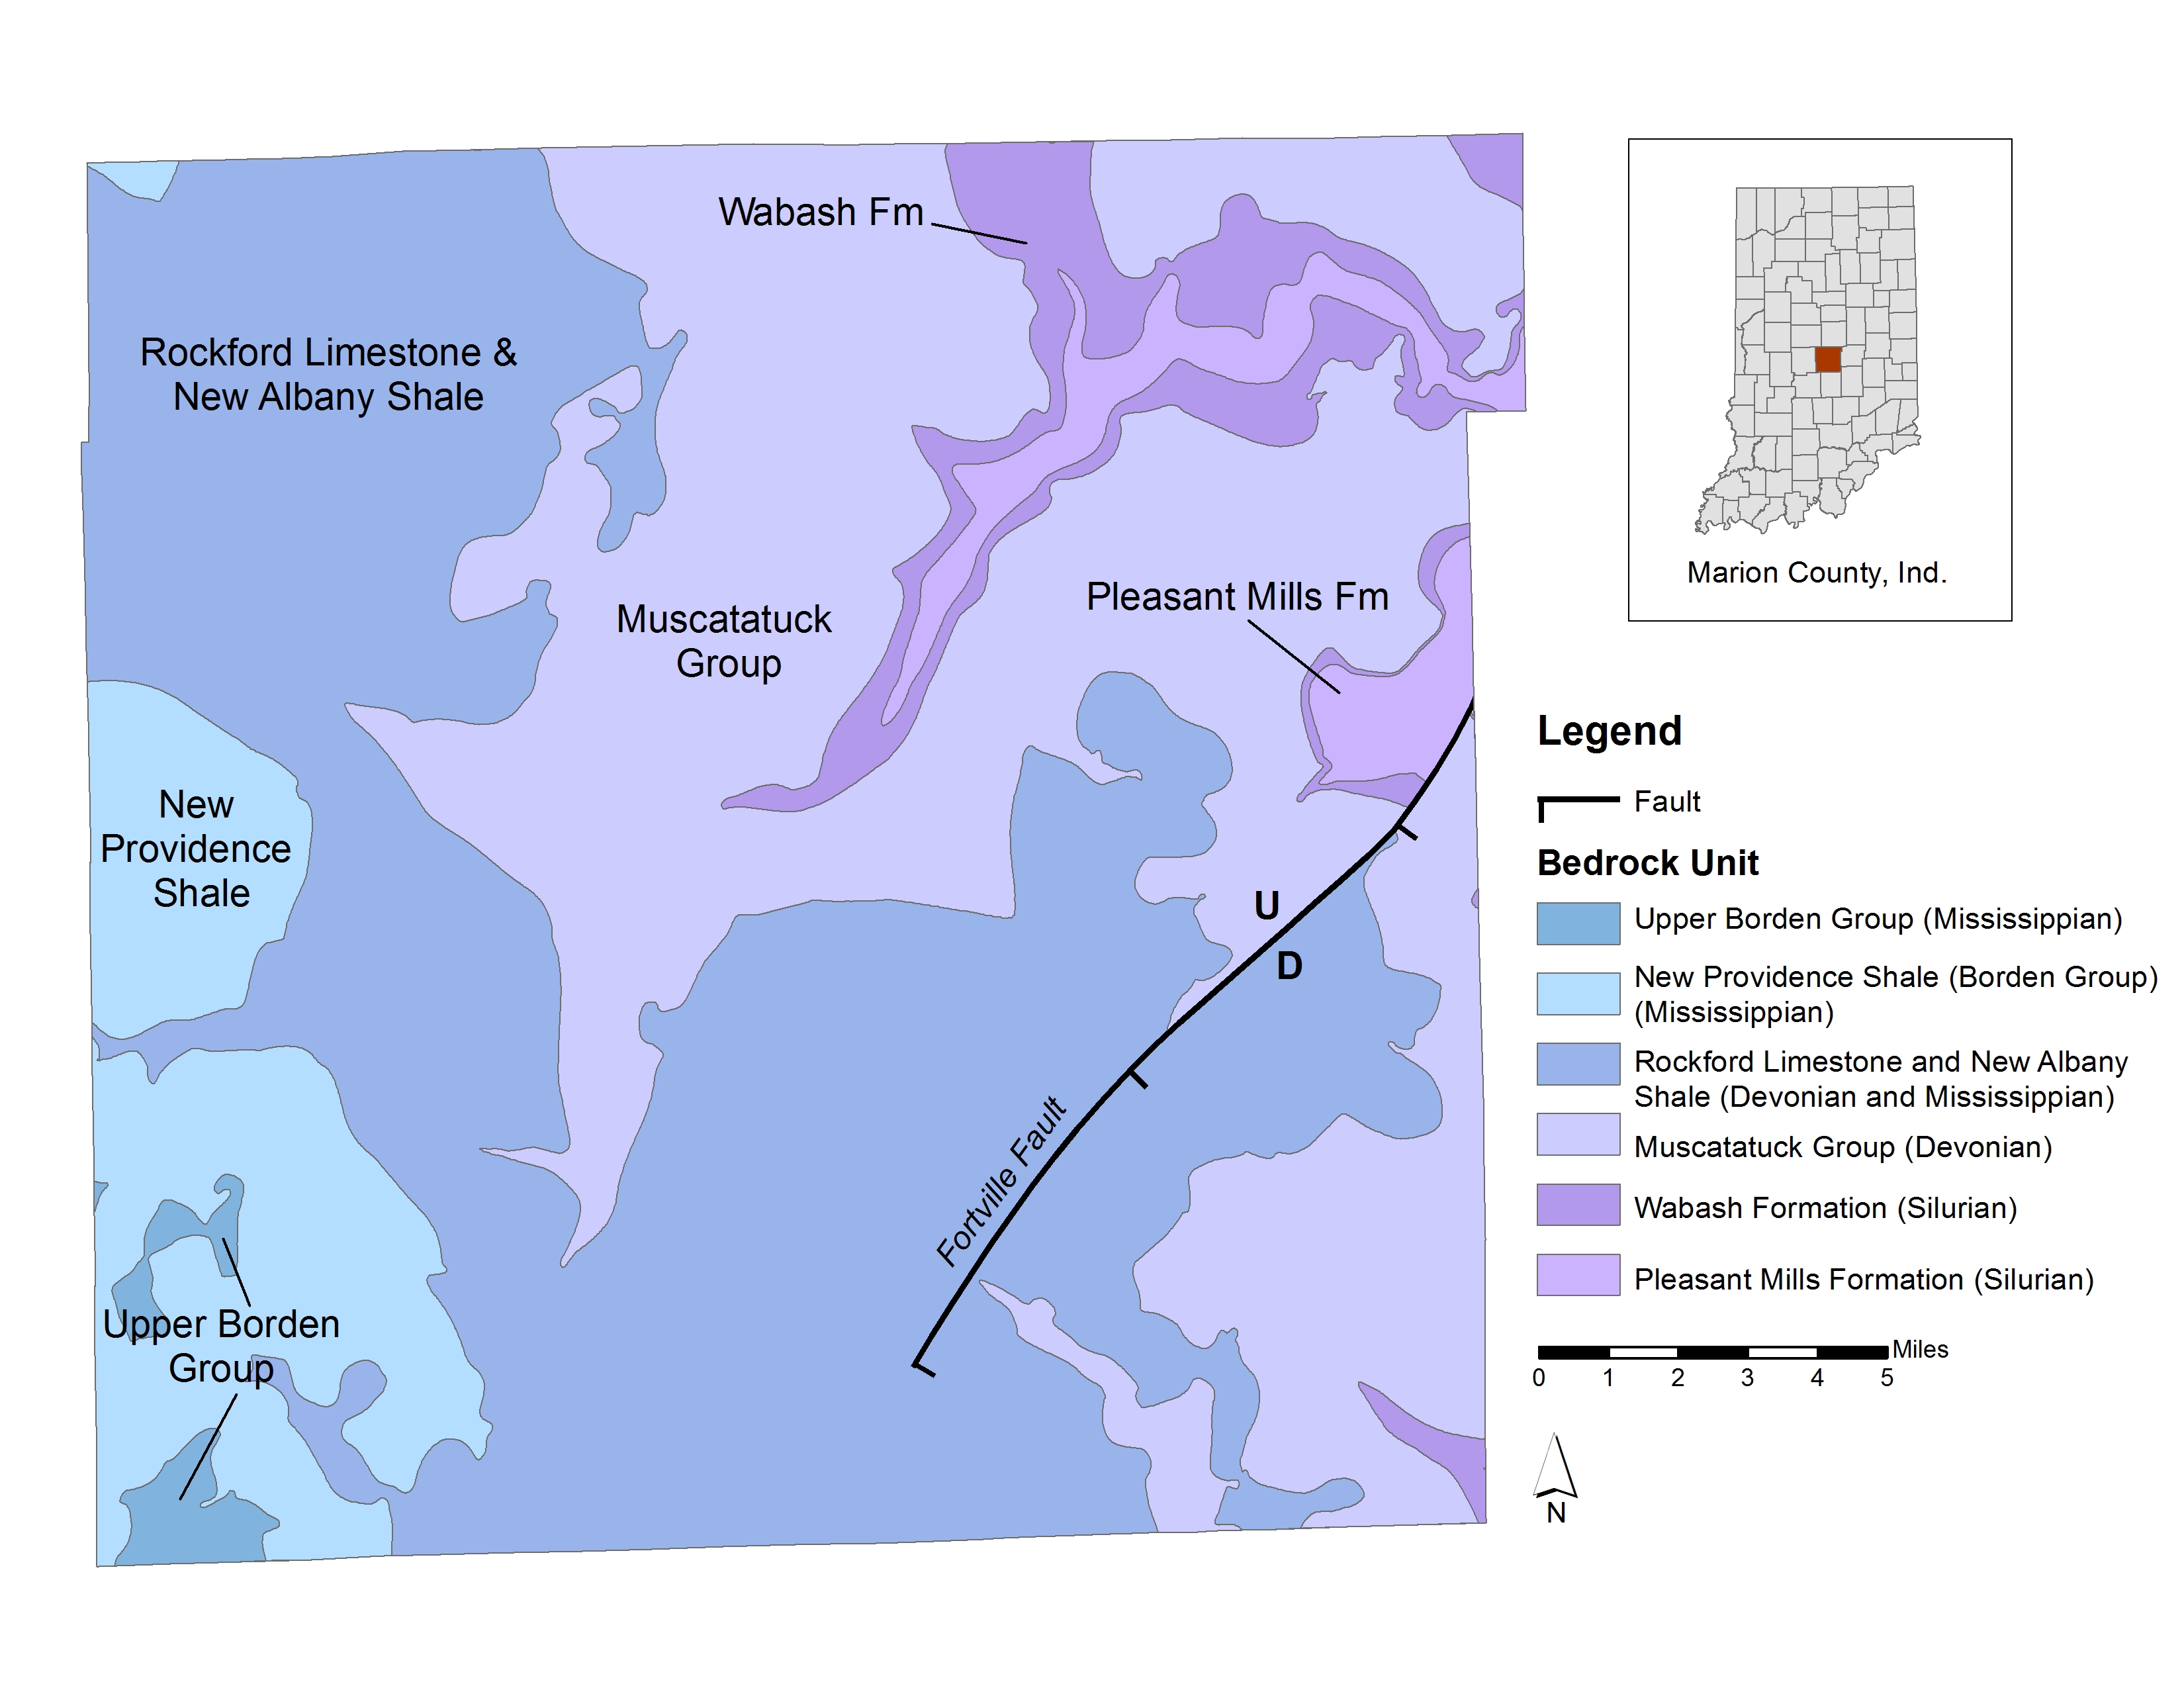
Figure 1.
Map showing the bedrock geology of Marion County (modified from Hasenmueller, 2003a, b).
The bedrock surface in Marion County is composed of
Paleozoic stratigraphic units ranging from
Silurian to
Mississippian age (Hasenmueller, 2003a, b) (fig. 1).
These units are composed of shales,
siltstones,
sandstones,
limestones, and
dolostones.
The relief on this bedrock surface is more than 300 ft (91.4 m), with elevations ranging from 505 to 808 ft
(153.9 to 246.3 m) (Hasenmueller and James, 2003a, b) (fig. 2). The bedrock surface is mantled by
unconsolidated
deposits that range in thickness from a few feet to more than 300 ft (91.4 m) (Fleming, Brown, and Ferguson,
2000; James and Hasenmueller, 2003a, b) (fig. 3). Typical depths to bedrock are in excess of 100 ft (30.48 m)
over most of the county. Fleming, Brown, and Ferguson (2000) noted that the bedrock is exposed naturally only
in two small areas, one being along the White River in Broad Ripple (Indianapolis West quadrangle), and the
second in the extreme southwestern part of the county near the Village of West Newton (Bridgeport quadrangle).
Because the bedrock surface cannot be directly observed, its topography and geology were inferred from petroleum
and water well records, gamma-ray logs, seismic records, and other sources of subsurface information (Fleming,
Brown, and Ferguson, 2000; Hasenmueller, 2003a, b; Hasenmueller and James, 2003a, b).
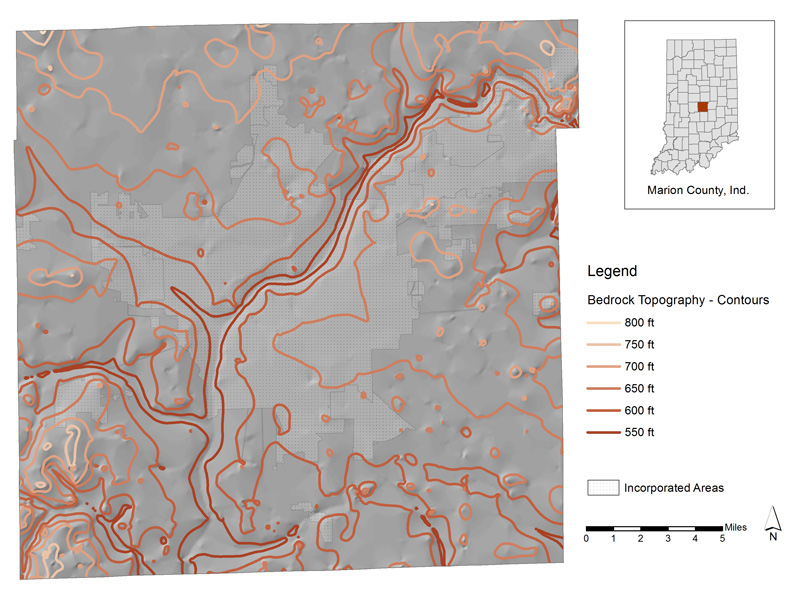
Figure 2.
Map showing the bedrock elevation of Marion County (modified from Hasenmueller and James, 2003a, b). Contour interval is 50 ft (15.2 m).
The lowest bedrock elevations are within a deeply entrenched bedrock valley system in the northeastern part of
Marion County, whereas the highest elevations occur along bedrock ridges associated with the buried
Knobstone Escarpment
in the southwestern part of the county (Fleming, Brown, and Ferguson, 2000). The pattern of relief
on the bedrock surface reflects several pre-glacial or interglacial valley systems superposed on broader
physiographic regions
controlled by the general resistance of particular types of bedrock to erosion (Fleming,
Brown, and Ferguson, 2000). For example, much of the bedrock surface underlain by the
Devonian and Mississippian
shales of the New Albany Shale forms a broad, rolling lowland that contains the axes of one or more major bedrock
valleys. In contrast, the bedrock surface formed on the resistant siltstones and sandstones of the Mississippian
Borden Group exhibits more than 250 ft (76.2 m) of local relief, characterized by sharp ridge crests adjacent to
narrow, deep valleys (Fleming, Brown, and Ferguson, 2000). A rolling plateau, cut by several canyonlike valleys
and containing locally abundant sinkholes, is characteristic of the bedrock surface on the Silurian and Devonian
carbonates (Fleming, Brown, and Ferguson, 2000).
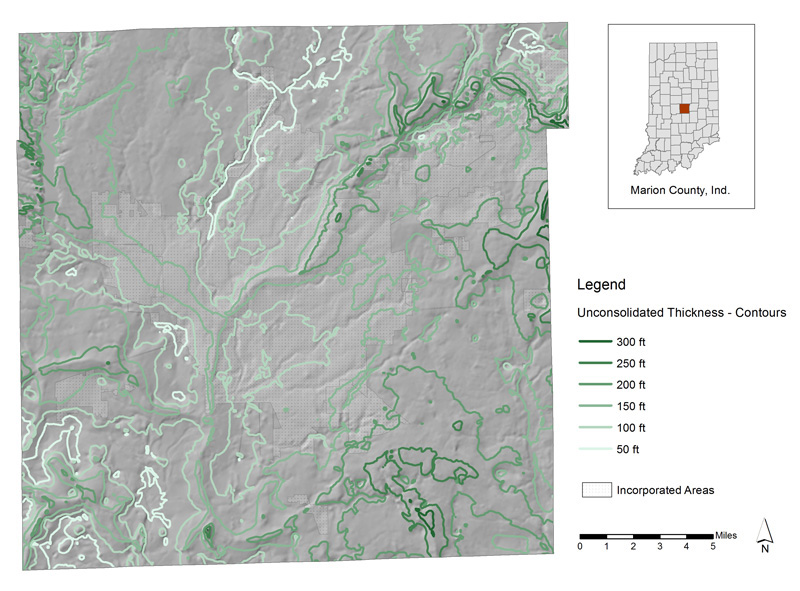
Figure 3.
Map showing the thickness of unconsolidated material in Marion County (modified from James and Hasenmueller, 2003a, b,). Contour interval is 50 ft (15.2 m).
The bedrock surface appears to have been modified by glacial activity, particularly that of channelized
meltwater.
Fleming, Brown, and Ferguson (2000) reported that most of the bedrock uplands have, at one time or another,
undergone direct erosion by glacial ice, whereas some of the bedrock lowlands may have been protected from
glacial scouring and remain largely unchanged from their pre-glacial configuration. Some of the larger bedrock
valley systems, however, may have been greatly modified, and some were perhaps cut in their entirety, by torrents
of meltwater (Fleming, Brown, and Ferguson, 2000). Although the details of this history are mostly obscured by the
overlying glacial deposits, the general pattern of repeated scouring and filling of some bedrock valleys is
abundantly clear on the basis of such evidence as cross-cutting
thalwegs, breached
drainage divides, inset fill
stratigraphy, and cross-cutting
outwash channels of vastly different ages (Fleming, Brown, and Ferguson, 2000).
The bedrock surface formed on the Silurian and Devonian carbonate rocks is characterized by relict
karst
(Fleming, Brown, and Ferguson, 2000). Karst features are not directly observable in most of Marion County
except in quarry exposures and underground limestone mines. Karst features, including sinkholes, small caves,
and other solution features, are abundant in the exposures of Silurian and Devonian carbonate rocks in
southeastern Indiana (Powell, Frushour, and Harper, 2002).
References
Fleming, A. H., Brown, S. E., and Ferguson, V. R., 2000, Geologic and hydrogeologic framework, in Brown, S. E., and Laudick, A. J., eds., 2003, Hydrogeologic framework of Marion County, Indiana-a digital atlas illustrating hydrogeologic terrain and sequence: Indiana Geological Survey Open-File Study 00-14, CD-ROM.
Hasenmueller, W. A., 2003a, Bedrock geologic map of the Indianapolis 30 x 60 minute quadrangle, central Indiana: Indiana Geological Survey Open-File Study 03-07, scale 1:100,000.
Hasenmueller, W. A., 2003b, Bedrock geologic map of the west half of the New Castle 30 x 60 minute quadrangle, central Indiana: Indiana Geological Survey Open-File Study 03-10, scale 1:100,000.
Hasenmueller, W. A., and James, C. L., 2003a, Map showing elevation of the bedrock surface in the Indianapolis 30 x 60 minute quadrangle, central Indiana: Indiana Geological Survey Open-File Study 03-03, scale 1:100,000.
Hasenmueller, W. A., and James, C. L., 2003b, Map showing elevation of the bedrock surface in the west half of the New Castle 30 x 60 minute quadrangle, central Indiana: Indiana Geological Survey Open-File Study 03-06, scale 1:100,000.
James, C. L., and Hasenmueller, W. A., 2003a, Map showing thickness of the unconsolidated deposits in the Indianapolis 30 x 60 minute quadrangle, central Indiana: Indiana Geological Survey Open-File Study 03-11, scale 1:100,000.
James, C. L., and Hasenmueller, W. A., 2003b, Map showing thickness of the unconsolidated deposits in the west half of the New Castle 30 x 60 minute quadrangle, central Indiana: Indiana Geological Survey Open-File Study 03-14, scale 1:100,000.
Powell, R. L., Frushour, S. S., and Harper, Denver, 2002, Distributions of sinkholes, sinking-stream basins, and cave openings in southeastern Indiana: Indiana Geological Survey Miscellaneous Map 64, scale 1:250,000.