

 Figure 1.
Map of 0- to 50-ft clay interval with color ramp (Olejnik, 2006b). The color ramp emphasizes the end members of the unconsolidated materials with the mostly clay sediments in blue and the less clay-rich, or mostly granular, sediments in red. The middle of the color ramp, in white, shows the areas that contain more equal mixtures of clay and granular sediments. The amounts of clay shown are not continuous amounts of clay but are a total amount of the clay present in the top 50 ft of sediment.
The Allen County interactive map displays two clay thickness map layers. One layer shows
the amount (thickness) of clay in the uppermost 25 ft of unconsolidated sediments; the
other shows the thickness of clay in the uppermost 50 ft of sediments. These maps show
the total amount of clay in each respective interval. The maps were constructed using the CLAY
The 0- to 50-ft clay thickness map shows the distribution of the amount of clay in the upper 50 ft of
Comparison of the
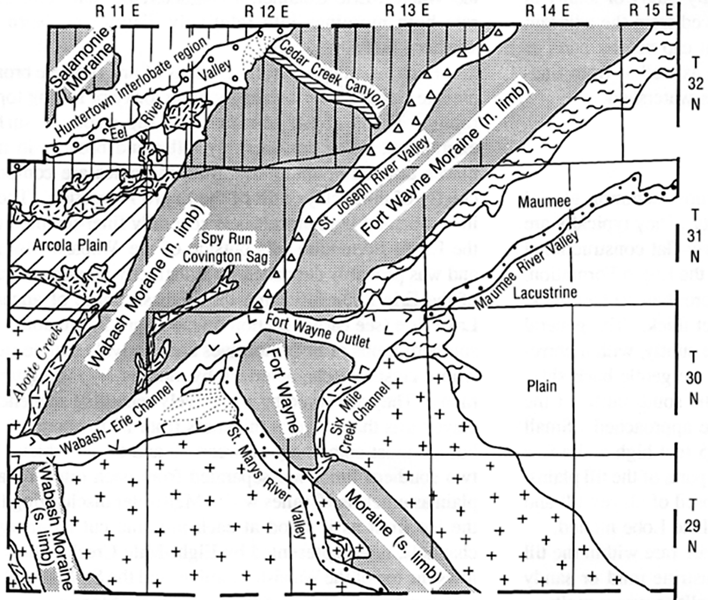 Figure 2.
Map of glacial terrains. From Fleming (1994).
 Figure 3.
Map of glacial terrains combined with the 0- to 50-ft interval.
References:
Fleming, A. H., 1994, The hydrogeology of Allen County, Indiana–a geologic and ground-water atlas: Indiana Geological Survey Special Report 57, 111 p.
Olejnik, J., (digital compiler), 2006a, CLAY_0_25FT_IGS_ALLEN: Cumulative thickness of clay in the 0- to 25-foot interval in Allen County, Indiana, based on iLITH data: Indiana Geological Survey, ESRI grid, 30 m.
Olejnik, J., (digital compiler), 2006b, CLAY_0_50FT_IGS_ALLEN: Cumulative thickness of clay in the 0- to 50-foot interval in Allen County, Indiana, based on iLITH data: Indiana Geological Survey, ESRI grid, 30 m.