

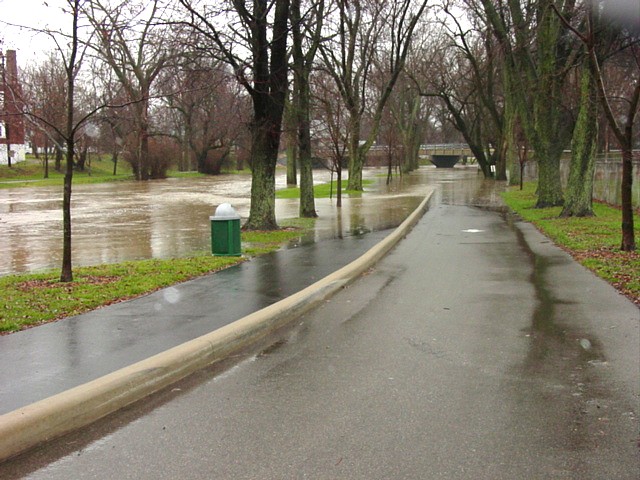
Fig 1. Floodwaters covering a roadway in Franklin, Indiana, in June 2008
Given the number of major rivers and tributaries that dissect Indiana and the fact that approximately 24 percent of the state was historically covered by wetlands, much of Indiana is susceptible to severe flooding, given the right circumstances. Conditions such as excessive rain, rapid snowmelt, and frozen ground prevent the upper soil surfaces from allowing water to percolate downward as groundwater and increase surface runoff, causing flooding.
The June 2008 floods (fig. 1) are a recent example of the devastation that flooding can cause. During an already wet spring, nearly a foot of rain was dumped on the saturated soils of Franklin and Edinburgh in just seven hours. This rain was unable to infiltrate the water-logged ground and was shed into the West Fork White River, East Fork White River, Flatrock River, and other smaller tributaries. The result for the surrounding areas of Franklin, Columbus, Martinsville, and low-lying parts of Brown County was record-setting high-water levels and widespread damage. After the storms passed, all but 10 of Indiana's 92 counties were declared presidential disaster areas (Lotshaw, 2010). At least two deaths were caused by the floods and an estimated half a billion dollars in damage was done in Columbus alone, where the hospital was inundated with water and was closed for months (Schilling, 2008; Columbus Republic, 2010).
Perhaps the most famous flood in Indiana history, the Great Flood of 1913, occurred along the Ohio, Wabash, and several other rivers, affecting the entire midwestern United States. A series of storms in late March poured several inches of rain on saturated ground and nearly all the water was forced into tributaries as runoff. Some sources indicate that frozen ground did not contribute to flooding in the Ohio Valley (Bybee and Malott, 1914). However, it is known that portions of some contributing watersheds in central Indiana had freezing temperatures in late March of 1913 (NOAA, 2007, 2011; WeatherSource, 2011), offering the possibility that frozen ground in tributary watersheds may have contributed to flooding in larger rivers. Nearly every town in Indiana located along a major drainage experienced flooding, including Indianapolis, Peru, Terre Haute, Muncie, Carmel, Danville, and Shelbyville. The widespread flooding caused an estimated $25 million of damage statewide (in 1913 currency) (Germano, 2008). Another infamous flood occurred along the Ohio River Valley in early 1937. Severe winter storms in the Midwest brought the Ohio River to record high levels in Evansville and Mt. Vernon, leading to intense flood damage across much of the southern edge of the state (Lilly Library, 2009).
While the 1913, 1937, and 2008 floods were devastating, they are only three of a number of floods that ravaged portions of Indiana throughout recorded history. Measures have been taken in many riverside towns and farmlands in Indiana to control the flood stages of rivers by constructing flood gates, levees, and pumping stations. While these have often proven useful for reducing the severity of the effects of flooding in many places, levees are commonly earthen in construction and prone to failure, given extreme conditions. By restricting flow to a narrower channel, levees increase flow velocities and remove the natural connection between river and floodplain, thereby increasing erosion potential and limiting the floodplain's capacity to store flood water as groundwater and slowly release it following the storm. Therefore, when levees are built, planners must anticipate and take into consideration downstream effects.
Many levees are designed to protect against 100- or 500-year floods. Despite this design consideration, it is often difficult to predict with accuracy the actual areal extent of a flood of a given magnitude. The recurrence interval is the number of years that statistically should pass between stream discharges of a given magnitude. Recurrence intervals are determined based on a statistical analysis of stream gauge data, highlighting the importance of maintaining gauging stations and establishing long-term data sets. The Indiana Department of Natural Resources is responsible for developing flood insurance rate maps that use topographic data and high-water marks (elevations of flood waters based on field observations) to model the areal extent of flood waters for given recurrence intervals along rivers. Insurance companies use these maps to establish the cost of flood insurance, as well as developers and city planners who hope to minimize damages associated with flood events.
In addition to the risk of casualty and damage to property associated with flooding, floods have often cut off vital transportation routes and utility services to afflicted towns. The loss of major transportation routes poses a serious threat to communities that rely on importing supplies such as food, water, and medicine. During the floods of 2008, several major highways in Indiana were closed (including Interstate 65), isolating some communities until flood waters receded. Depending on the length of time that a community is isolated, starvation, exposure, injury, and disease can all potentially lead to health problems and possibly fatalities. To further elevate the risk of disease, populated areas that are flooded often experience a backup in their sewage disposal systems, causing raw sewage to be mixed with flood water. Fire is another risk tied to urban flooding conditions; lack of accessibility makes combatting fires difficult and, as a result, portions of towns have burned to the ground during major floods.
While Indiana will always be at risk of flooding, modern communication systems make it much easier to give advanced warning to people in potentially afflicted areas, resulting in enhanced preparation and decreased casualties. The National Weather Service tracks the measured precipitation and the levels of hundreds of river gauges across the Ohio River Basin to provide accurate forecasting models and advanced warning for potential floods (NWS, 2011). Still, anyone who lives in or near the flood plains of a major creek or river should be aware of the possible dangers associated with flooding and take the necessary precautions. Remember, a 500-year flood could happen in any year.
Additional Resources
- National Weather Service Ohio River Forecast Center
- Indiana DNR: Floodplain Management
- FEMA - FIRMette Flood Maps - Find Your Own Flood Map
References
Bybee, H.P. and Malott, C.A., 1914, “The Flood of 1913 in the Lower White River Regions of Indiana," Indiana University Bulletin, XII (October, 1914), p. 125-126
Columbus Republic, 2010, Flood top local story of decade: The Columbus Republic, January 10, p. A1
Germano, N. M., 2008, White River and the “Great Flood" of 1913: Marion County Historical Society Web site, <http://www.mchsindy.org/history/1913flooding_article.pdf>, date accessed, March 10, 2011.
Lilly Library, 2009, “Ohio River Flood of 1937": Lilly Library Web site, <http://www.indiana.edu/~liblilly/wpa/flood.html>, date accessed, March 30, 2011.
Lotshaw, T., 2010, FEMA buyout money hung up in Congress: The Brown County [Indiana] Democrat, April 28, p. A1.
National Oceanic and Atmospheric Administration (NOAA), 2011, “Spring Last Freeze Information:" National Oceanic and Atmospheric Administration Web site, <http://www.erh.noaa.gov/ohrfc/>, date accessed, Feb. 20, 2012.
National Oceanic and Atmospheric Administration (NOAA), 2007, “Daily Weather Maps:", National Oceanic and Atmospheric Administration Web site, <http://docs.lib.noaa.gov/rescue/dwm/data_rescue_daily_weather_maps.html>, date accessed, February Feb. 20, 2012
National Weather Service (NWS), 2011, Ohio River Forecast Center: National Oceanic and Atmospheric Administration Web site, <http://www.erh.noaa.gov/ohrfc/>, date accessed, March 31, 2011.
Schilling, C., 2008, Historic flood swamps area: The Columbus Republic, June 9, p. SS1.
WeatherSource, 2011, Free Weather History Reports: WeatherSource Web site, <http://weathersource.com/past-weather/weather-history-reports/free/>, date accessed, Feb. 20, 2012.