

In Indiana, extensive agricultural areas were developed on glacial outwash deposited in floodways of major streams and on outwash fans and wind-blown sands. Because infiltration is rapid and direct in these hydrogeologic settings, groundwater is subject to degradation by nitrates derived from agricultural sources such as inorganic fertilizers, crop residues, applied manure, and manure from grazing cattle. However, a previous investigation in Jackson County, Indiana, indicated that denitrification occurs as groundwater migrates downward, so that shallow aquifers in this type of hydrogeologic setting are candidates for remediation.
As part of this investigation, a variety of experimental practices were employed by participating farmers in an attempt to reduce the leaching of nitrates into groundwater. Groundwater chemistry was monitored in six irrigated test plots to determine if such practices resulted in measurable improvements in water quality. The experimental practices that were employed included (1) systematic reductions in the application of nitrogen fertilizers from 185 lbs/acre of total chemical nitrogen (N) to only 80 lbs/acre N, (2) application of nitrification inhibitors (N-serve and Agrotain), and (3) aerial seeding of rye in corn fields late in the growing season.
The results of the investigation indicate that, following application of standard quantities of inorganic fertilizers (typically about 185 lbs/acre N), nitrate concentrations in the uppermost 18 inches of groundwater naturally decline to values that are less than the Drinking Water Standard limits (10 mg/l) in a period of about 6 to 18 months.
When nitrification inhibitors are used in conjunction with greatly reduced fertilizer applications (to as little as 80 lbs/acre N), concentrations of nitrate-nitrogen exhibit relatively small increases--or even slight decreases--in groundwater in post application rounds of sampling. However, it was determined that such large reductions in the application rate of fertilizers are associated with reductions in corn yields of 10 to 20 bushels/acre. Yields might have been even more adversely affected if nitrate-bearing groundwater had not been used for irrigation.
An attempt to evaluate the effects of planting rye was inconclusive.
Reliable and long-term reduction of nitrate concentrations in groundwater to less than 10 mg/l might require even greater reductions of fertilizer applications to less than 80 lbs/acre N. Such further reductions would lead to declines in crop yields that would be unacceptable to farmers. Consequently, with current agricultural practices, persons who wish to use shallow groundwater as a domestic supply of drinking water in such hydrogeologic settings should consider the creation of protection areas around their wells. The results of the investigation indicate that setbacks of 200 ft, and possibly less, may be adequate, particularly if drainage ditches can be installed between the protection areas and cultivated fields.
INTRODUCTION
Groundwater quality in the major glacial-outwash aquifer system that occupies the floodplain of the East Fork of the White River, northwest of Seymour in Jackson County, Indiana, has been seriously degraded by anthropogenic nitrate. Most of the shallow (less than 25 ft deep) domestic drinking-water wells produce water having nitrate concentrations that approach or exceed the Drinking Water Standard limits of 10 mg/l, established by the U.S. Environmental Protection Agency (EPA).
An earlier investigation, conducted between September 1999 and September 2003 in an area north of Cortland, identified the sources of nitrogen that are responsible for contamination of the aquifer. The study area was a 15-square-mile section that lies northwest of the river, where the aquifer is 30 to 60 ft thick and consists of sand and fine gravel, overlain by 6 to 12 ft of somewhat less permeable overbank (alluvial) material (fine sand and silt with some clay). The soils are thick, level, well drained, and moderately fine- to coarse-grained in texture, with relatively low organic content. The aquifer lies on lake clay and shale, both of which have very low permeability. Samples collected from wells installed in farm fields implicated inorganic sources (namely fertilizers) or mixed inorganic and organic sources (namely animal waste), whereas wells adjacent to and down-gradient from concentrated animal feeding operations (CAFOs) indicated animal waste sources.
The earlier investigation also indicated that denitrification occurs in the aquifer as the vertical component of the Groundwater flow system carries the nitrate downward into the anoxic zone at a depth of 25 to 30 ft. It was suggested that, with the implementation of best management practices (BMPs), naturally occurring denitrification and recharge from precipitation make this aquifer a potential candidate for remediation.
The hydrogeologic setting described above is common to the floodways of many of the major streams that flow in glacial meltwater channels in Indiana. Also, there are other geologic settings in glaciated portions of Indiana that create similar hydrologic conditions. For example, outwash fans in the northeastern part of the state and wind-blown sands in the northwestern part are similar hydrologically in that they consist of thick deposits of coarse-grained materials (fig. 1). groundwater in each of these settings is quite sensitive to contamination from surface-applied chemicals.
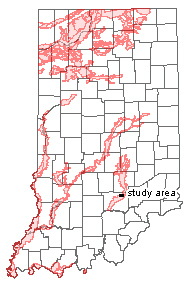
Figure 1. Map showing areas in Indiana that have hydrogeologic settings that are the same or similar to the setting of the study area. The total area is almost 3 million acres, of which 26 percent was planted in corn in 2003.
This report discusses a cooperative effort of the Indiana Geological and Water Survey (IGWS), local farmers, and local farm service companies to establish a program to implement BMPs for fertilizer application and to continue Groundwater monitoring in the same area as the earlier investigation. The purpose of the project, which lasted from October 2003 to October 2007, was to assist farmers with optimizing the rate, method, and timing of their nutrient applications thereby minimizing the entry of nitrate into the aquifer. Six test plots were established, in which monitoring wells were installed to collect samples of water that leached from those fields to the aquifer to track any changes in nitrate concentrations through time that might indicate which experimental procedures are most effective. Selected monitoring wells from the earlier investigation continued to be sampled on a quarterly basis to provide information on changes in nitrate concentrations in the traditionally managed areas surrounding the test plots.
The map in Figure 1 was derived from a statewide map showing hydrogeologic settings by Fleming and others, 1995 (Atlas of hydrogeologic terrains and settings of Indiana, Indiana Geological Survey Open-File Report 95-7). Fleming used existing maps of surficial geology, as well as logs of water wells on file at the Indiana Department of Natural Resources, groundwater Section, to construct three-dimensional interpretations of the hydrogeology of Indiana.
Groundwater MONITORING
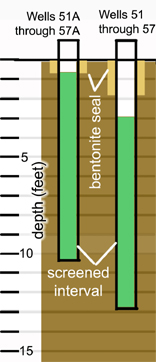
Schematic diagram showing installation of Wells 51 through 57 and Wells 51A through 57A
Wells were installed using a 4ft hollow-stem auger. Materials coarsen downward from silt, fine sand, and clay to fine to coarse sand and some gravel,
with minor silt and clay at depths of 8 to 12 ft.
Monitoring Wells. In consultation with cooperating farmers, six fields, each of which is approximately 40 acres, were selected to serve as test plots (fig. 2). Six shallow monitoring wells (Wells 51, 52, and 54 through 57) were installed in these fields in November 2003 for the purpose of monitoring nitrate concentrations in the uppermost 18 inches of the aquifer. As a control, a well was also installed in an adjacent, uncultivated wood lot (Well 53). In addition, several preexisting monitoring wells from the earlier investigation were included in the study.
The wells, which were 2 inches in diameter, were constructed with 3 ft of PVC casing above 10 ft of screen. The annulus around each screen was packed with silica sand and sealed at the surface with 2 ft of bentonite.
Depending on precipitation, it was observed that the level of the water table can vary seasonally by as much as 5 to 9 ft. On November 9, 2004, seven new wells (referred to as "Wells 51A through 57A") were installed immediately adjacent to the existing wells. These wells, which had 6 inches of casing above 10 ft of screen, were installed to provide a screened interval within the previously unscreened depths between 0.5 and 3 ft below the surface. These wells were sampled during periods when the water table was exceptionally high.
Precipitation within the study area (measured as "inches of water") was continuously recorded using a tipping-bucket rain gauge connected to an electronic data logger, and daily total accumulations were then calculated. In selected wells, water levels (measured as "ft above mean sea level") were measured hourly using a Solinst Levelogger Gold instrument, which is a nonvented pressure transducer with onboard data logging, corrected for atmospheric pressure fluctuations with a barometric logger. Daily average values were then calculated.
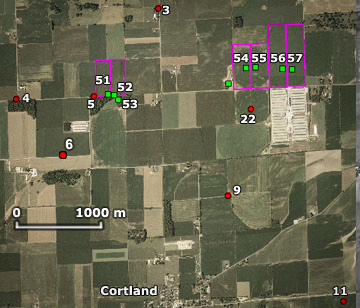
Figure 2. Aerial photograph of the study area, showing the locations of test plots (magenta outlines) and monitoring wells.
Green squares indicate monitoring wells in test plots. Red circles indicate preexisting monitoring wells from an earlier investigation
in surrounding areas.
Sampling Method. Samples of groundwater were extracted from the monitoring wells by using a low-flow submersible pump; samples from the wells in the test plots were obtained from the water column immediately below the water table (within 18 inches) by insertion of an inflatable bladder at the base of the pump. Collection of samples from the uppermost part of the saturated zone provided evidence of nitrates that are leached from the overlying, unsaturated soil profile by water that infiltrates after precipitation or irrigation events.
Sampling Schedule. Approximately four water samples were collected annually from the monitoring wells in the test plots and from selected preexisting wells in surrounding areas. Samples were collected before and after the application of nitrogen fertilizers (described below), around harvest time, and during winter. The post-application samples were not collected until after the area had experienced a significant rainfall or irrigation event (table 1).
| TABLE 1. Collection of Groundwater Samples | ||
| Date | Sampled Wells | Reason for Sampling |
| 2004 CALENDAR YEAR | ||
| March 2 | 5, 51 through 57 | Before application of nitrogen fertilizers |
| March 3 | 3, 4, 6, 9, 11, 22 | |
| May 5 | 51 through 57 | After application of nitrogen fertilizers associated with Wells 54 and 55 |
| June 1 | 51 through 57 | After application of nitrogen fertilizers associated with Wells 56 and 57 |
| June 2 | 3, 4, 5, 9, 11, 22 | After application of nitrogen fertilizers |
| October 21 | 3, 4, 5, 9, 11, 22, 51 through 57 |
After harvest |
| 2005 CALENDAR YEAR | ||
| January 18 | 51 through 57 | Mid-winter sampling |
| April 15 | 3, 4, 5, 6, 9, 11, 22, 51 through 57 |
Before application of nitrogen fertilizers |
| June 13 | 51 through 57 | After application of nitrogen fertilizers |
| June 28 | 3, 4, 5, 6, 9, 11, 22 | |
| November 2 | 3, 4, 5, 6, 9, 11, 22, 51 through 57 |
After harvest |
| 2006 CALENDAR YEAR | ||
| February 1 | 3, 4, 5, 6, 9, 22, 51 through 57 |
Mid-winter sampling |
| April 18 | 3, 4, 5, 6, 9, 22, 51 through 57 |
Before application of nitrogen fertilizers |
| May 16 | 9, 51 through 57 | After application of nitrogen fertilizers |
| May 22 | 3, 4, 5, 6, 22 | After application of nitrogen fertilizers |
| June 5 | 56 and 57 | After application of pesticides |
| June 20 | 56 and 57 | After application of pesticides |
| November 9 | 3, 4, 5, 6, 9, 22, 51 through 57 |
After harvest |
| 2007 CALENDAR YEAR | ||
| May 1 | 51 through 57 | Before application of nitrogen fertilizers |
| June 18 | 51 through 57 | After application of nitrogen fertilizers |
| September 18 | 3, 4, 5, 6, 9, 22, 51 through 57 |
After harvest |
Chemical Analyses.
Water samples were submitted to the Indiana State Department of Health (ISDH) for analysis. Their analyses included nitrate plus nitrite as N,
chlorides as Cl, sulfates as SO4, phosphates as PO4, sodium, and potassium.
All analyses were reported as "milligrams per liter" (mg/l).
Isotopic Analyses.
Isotopic ratios of nitrogen
(15N/14N) can be used as indicators of nitrogen sources. Within the study area, several such sources existed, including
inorganic fertilizers (applied primarily to corn crops), nitrogen fixed by soybeans, crop residues, and manure from cattle. Relatively low
values of nitrogen isotopes indicate relatively greater influence of inorganic fertilizers (-5 to +5 per mil), while relatively high values
indicate a greater influence of organic sources such as manure (10 to 20 per mil) or vegetable matter (3 to 9 per mil).
In order to qualitatively evaluate the relative importance of various nitrogen sources in the test plots, samples were collected on May 16, 2006, from each of the test wells. At the time the samples were taken, inorganic fertilizers had recently been applied to Fields 54 through 57, and soybeans had been harvested in Fields 54 and 55 during the previous growing season. Also, cattle had been pastured in Fields 51 and 52 in spring 2006, and in Fields 54 and 55 in spring 2005. The samples were submitted to the Environmental Isotope Lab, Department of Earth Sciences, University of Waterloo for analyses.
The sample from Well 53 (7.49 per mil) in the wood lot, where inorganic fertilizers had never been applied and where cattle had never been pastured, indicated predominantly organic sources of nitrogen (presumably decaying wood and leaf litter) (Table 2). In contrast, samples from Wells 56 and 57 (0.19 and 0.09 per mil, respectively), where inorganic fertilizers had been heavily applied, but where cattle had never been pastured, indicated exclusively inorganic sources (presumably from inorganic fertilizers). Isotopic values from Wells 51, 52, 54, and 55 (ranging from 1.69 to 6.46 per mil), whose associated fields received large applications of inorganic fertilizers whenever corn was cultivated and where cattle were pastured during winter and spring months following corn harvests, indicated the presence of mixed organic and inorganic sources of nitrogen.
| TABLE 2. Isotopic Analyses | |
| Well | 15N/14N |
| 51 | 2.98 |
| 52 | 4.33 |
| 53 | 7.49 |
| 54 | 6.46 |
| 55 | 1.69 |
| 56 | 0.19 |
| 57 | 0.09 |
Thus, the results of the isotopic analyses confirmed the assumptions of the investigators, based on conversations with the participating farmers, regarding the relative importance of various nitrogen sources in the six test plots.
STANDARD MANAGEMENT PRACTICES
In this region, farmers typically plant their fields in an annual rotation of corn and soybeans (Table 3). With conventional practices, when corn is planted, farmers typically apply relatively large quantities of nitrogen fertilizers (as much as 210 lbs/acre N) shortly before, during, and (or) after planting. In the past, because fertilizer was relatively inexpensive, farmers applied an amount that was designed to exceed the maximum potential yield for the most productive soil series in each field. During years when soybeans are being cultivated, nitrogen fertilizers are not applied. (As a rule of thumb, the participating farmers consider a soybean crop to be the equivalent of applying 25 to 30 lbs/acre N in the following year.) Other crops are occasionally planted, including green beans. When green beans are planted, their harvest is normally followed by the planting of soybeans, providing two crops during a single growing season. Like corn, green beans require nitrogen fertilizers.
| TABLE 3. Dates of Chemical Applications and Plantings | ||||
| Field | Date | Chemical Application | Application Rate | Planting |
| 2004 GROWING SEASON | ||||
| 51, 52 | 5/28/04 | Soybeans | ||
| 55 | 4/20/04 | Anhydrous ammonia (82% N) N-Serve |
N - 180 lbs/acre N N-serve - 1 qt/acre |
|
| 54 | 4/28/04 | Urea (46% N) | N - 172 lbs/acre N | |
| 54, 55 | 5/10/04 | 19-18-0 | N - 36 lbs/acre N | Yellow corn |
| 56 | 4/16/04 | 19-18-0 | N - 30.4 lbs/acre N | White waxy Japanese corn |
| 57 | 4/17/04 | |||
| 56 | 5/18/04 | Anhydrous ammonia (82% N) | N - 185 lbs/acre N | |
| 57 | N - 185 lbs/acre N (westernmost 24 rows) N - 125 lbs/acre N (west-central 24 rows) N - 150 lbs/acre N (east-central 24 rows) N - 185 lbs/acre N (easternmost 24 rows) |
|||
| 55, 56 | 9/2/04 | Rye | ||
| 2005 GROWING SEASON | ||||
| 51 | 4/30/05 | Anhydrous ammonia (82% N) N-serve |
N - 150 lbs/acre N N-serve - 1 qt/acre |
|
| 51, 52 | 5/3/05 | Corn | ||
| 52 | 6/8/05 | Anhydrous ammonia (82% N) | N - 120 lbs/acre N (eastermost 96 rows) N - 150 lbs/acre N (west-central 48 rows) N - 180 lbs/acre N (westernmost 48 rows) |
|
| 54, 55 | 6/4/05 | Soybeans | ||
| 56, 57 | 4/12/05 | Corn | ||
| 56 | 5/18/05 | Anhydrous ammonia (82% N) | N - 185 lbs/acre N (6 easternmost rows immediately east of well) N - 150 lbs/acre N (12 east-central rows) N - 125 lbs/acre N (12 west-central rows) N - 185 lbs/acre N (12 westernmost rows) |
|
| 57 | N - 125 lbs/acre N (inside 150-ft radius around well) N - 185 lbs/acre N (elsewhere) |
|||
| 2006 GROWING SEASON | ||||
| 51, 52 | Soybeans | |||
| 54 | 5/5/06 | Anhydrous ammonia (82% N) | N - 147 lbs/acre N | |
| 55 | 5/8/06 | Agrotain (stabilized urea)(46% N) |
N - 120 lbs/acre N | |
| 55 | 5/22/06 | 10-34-0 | N - 13 lbs/acre N | |
| 54, 55 | 5/22/06 | Corn | ||
| 56, 57 | 5/7/06 | 19-18-0 Ammonium sulfate (21% N) |
N - 62 lbs/acre N | |
| 56, 57 | Green beans Soybeans |
|||
| 2007 GROWING SEASON | ||||
| 51, 52 | 5/5/07 | Anhydrous ammonia (82% N) N-serve |
N - 80 lbs/acre N (120 ft on either side of wells) N - 120 lbs/acre N (elsewhere) N-serve - 1 qt/acre |
|
| 51, 52 | 5/10/07 | Corn | ||
| 54, 55 | 4/24/07 (green beans) 6/22/07 (soybeans) |
Green beans Soybeans |
||
| 54, 55 | 5/14/07 | Ammonium sulfate (21% N) | ||
| 56, 57 | 4/18/07 | Corn | ||
| 56 | 5/14/07 | Anhydrous ammonia (82% N) | N - 80 lbs/acre N (outside 75-ft radius around well) N - 160 lbs/acre N (inside 75-ft radius around well) |
|
| 57 | 5/14/07 | Anhydrous ammonia (82% N) | N - 80 lbs/acre N (inside 75-ft radius around well) N - 160 lbs/acre N (outside 75-ft radius around well) |
|
Fields 51, 52, 54, and 55 were tilled using a chisel plow and a seed-bed preparation tool. Nitrogen fertilizer was applied to these fields before planting by using a toolbar. Additional fertilizer was applied with the corn planter during planting. Fields 56 and 57 were also tilled with a chisel plow. Fertilizer was applied in the row with the corn planter during planting, and again later when the corn was 10 to 12 inches tall by using a toolbar.
Fields 54, 55, 56, and 57 (associated with Wells 54 through 57, respectively) were irrigated during summer growing seasons, as needed, using center-pivot irrigation systems whose water supply was derived by pumping from relatively deep levels (45 ft) of the same aquifer that was being studied. Irrigation was used in Fields 51 and 52 (associated with Wells 51 and 52, respectively) only during the 2007 growing season. The farmers used irrigation on as many as seven days per growing season, typically applying about 1 to 1.5 inches of water per irrigation event. The irrigation water contains as much as 9 mg/l of nitrate-nitrogen, so that as much as 21 lbs/acre N was recycled by applying irrigation water during the growing season.
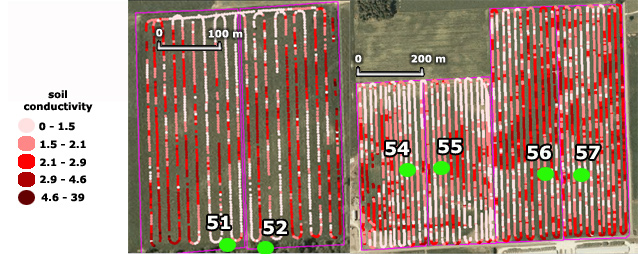
Soil conductivity measurements that were determined in 2004 by using Veris equipment in the test plots. Units of soil conductivity are milliSiemens/meter.
A cooperating farmer had the practice of pasturing his cattle in Fields 51, 52, 54, and 55 during winter and spring months whenever corn residue was present from the preceding harvest. Consequently, cattle were present in Fields 54 and 55 in spring 2005 and spring 2007, and in Fields 51 and 52 in spring 2006. It was observed by the investigators, particularly in spring 2005, that the cattle tended to congregate around Wells 54 and 55, where they used the stickups of the wells as scratching posts. On that occasion, the wells were thoroughly purged and flushed before sampling, using water from nearby wells in the same aquifer. No cattle were ever pastured in Fields 56 and 57.
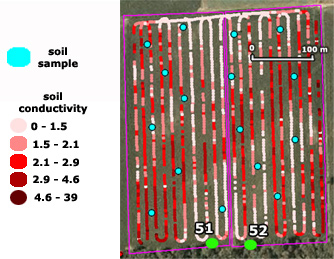
The relationship between the locations of soil samples and soil-conductivity measurements is shown for the test plots associated with Wells 51 and 52.
In order to obtain baseline information regarding soil characteristics, soil conductivity measurements within the test plots were made in early 2004, prior to spring planting. Maps of soil conductivity, seen above, were provided by a participating farm-service company. Based on the results of these measurements, soil sampling to determine cation-exchange capacity was conducted by the farm-service companies. An example of the relationship between the locations of soil samples and the distribution of soil-conductivity measurements is shown in a map of soil samples (as seen to the left) around Wells 51 and 52. From the soil samples, maps were created showing soil pH and concentrations of phosphorous and potassium.
EXPERIMENTAL MANAGEMENT PRACTICES
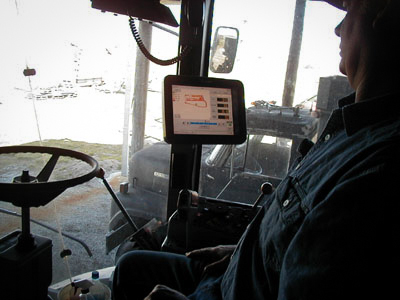
Participating farmer with a yield monitor installed in his combine.
Du